2 – Householders Survey
We delivered 357 survey sheets and received 181 completed ones; a fraction over 50%. The Rev. Stevens, in his survey of 1877, personally visited every household in the community and questioned the head of the household at length. This ensured a 100% response! In the ‘politically correct’ world of 2010, the Society felt that anonymity was crucial but this prevented any follow-up of households that failed to complete their simple survey form. However, the information retrieved should enable people in the future to have an insight into life in the Sibfords in 2010.
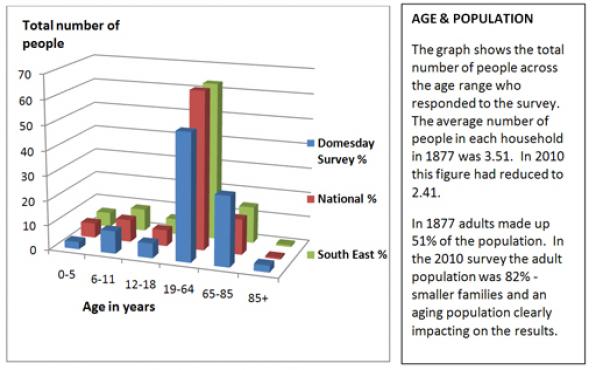
For the purposes of our analysis the 181 replies has formed the total basis of our survey and in all calculations is regarded as 100%. The first thing that stood out when reading the survey returns was the number of retired people who live in the village (40.5%). As we had only received 50% completed survey forms it was quite possible that our retired population may have had more time to complete the questionnaire. This made us realise that this figure and possibly some others, may not give as true a reflection of the population of our community as we had hoped. In the South East, only 13.79% of the population are retired.[1]
The first question we asked was how many people were in the household.
- 15.75% of the whole village community were born in the Sibfords.
- 9.36% of principal householders were born and still live in the village with the longest being 81 years. In 2010 the principal householder has lived in the villages for an average of 22 years.
- 10.61% of the population have lived in the villages for more than 50 years whilst 31.84% have lived in the villages for less than 10 years.
- 74.86% of householders own their property (68.71% nationally)
- The Main Paid Occupation (MPO) of the household represented a range of 56 different types of employment. (The 1877 survey showed 33 different occupations)
- 48.61% were full time, 10.49% were part time, 24.86% spent some time working from home, 7.73% had some form of secondary paid employment
- 9.93% provided paid services to the village as part of their paid occupation
- 40.33% of households have more than one person in paid employment (APE) representing a further 37 different occupations.
In 1877, 45% of principal householders were either farmers or worked on the land. In 2010 this figure had fallen to 2.79%.
The top ten occupations (MPO) of households as shown below
| OCCUPATION 2010 | % | Total Count | MPO Count | APE Count | |
| 1 | Teacher | 10.50 | 19 | 7 | 12 |
| 2 | Company Director | 6.63 | 12 | 9 | 3 |
| 3 | Consultant | 4.42 | 8 | 7 | 1 |
| 4 | Manager | 4.42 | 8 | 5 | 3 |
| 5 | Farmer | 3.87 | 7 | 4 | 3 |
| 6 | Administrator | 3.31 | 6 | 2 | 4 |
| 7 | Accountant | 2.76 | 5 | 5 | 0 |
| 8 | Lecturer | 2.76 | 5 | 2 | 3 |
| 9 | Nurse | 2.76 | 5 | 1 | 4 |
| 10 | Engineer | 2.21 | 4 | 4 | 0 |
| 10 | Insurance | 2.21 | 4 | 2 | 2 |
| OCCUPATION 1877 | % | ||
| 1 | Labourer /Farm worker | 34.27 | 61 |
| 2 | Farmer | 10.67 | 19 |
| 3 | Dairyman | 2.25 | 4 |
| 4 | Carrier | 2.25 | 4 |
| 5 | Baker | 1.69 | 3 |
| 6 | Carpenter | 1.69 | 3 |
| 7 | Mason | 1.69 | 3 |
| 8 | Painter | 1.69 | 3 |
| 9 | Shoemaker | 1.69 | 3 |
| 10 | Inn Keeper | 1.69 | 3 |
| 10 | Beershop | 1.69 | 3 |
| 10 | Shopkeeper | 1.69 | 3 |
| 10 | Servant | 1.69 | 3 |
In 1877 Farmers and farm labourers accounted for 44.94% of the working population compared to 3.87% in 2010. In fact in the top ten occupations in our survey there were no labourer/farm workers or tradesmen.
The Distance Travelled to Work by the principal householder is considerably different from the national figures.
- 20.44% travel less than 10 miles to work (58.32% nationally)
- 9.39% travel more than 60 miles to work (2.7% nationally)
- 7.73% walk to work (6.30% nationally)
- 38.12% use a car (34.68% nationally)
The Distance Travelled to Work by those in additional paid employment.
- 56.25% of those in additional paid employment travel less than 10 miles to work
- 12.50% of those in additional paid employment travel more than 60 miles to work
17.85% walk to work; 66.66% use a car. Other forms of transport included aeroplane, bus, cycle, motorcycle, train, boat, van and pick-up truck.
Only 12 households do not own a car. Nearly half the households have two or more cars (26.65% nationally) while eight households have four or more.
Telephones and the Internet
- Nearly 20% of households had 3 or more landline handsets
- 89% of households had one or more mobile phones.
- 74.58% have the internet at home and 12.84% shop exclusively on line.
Ina Lamb wrote in her report on village and school life in 1900: ‘There were no newspapers entering the village and most homes only contained a Bible and possibly one or two more religious books’. There is also no mention of any telephones in the village at this time although the Rev. Stevens in his diary in 1878 wrote: “29th November…. attended lecture on Telephone and Microphone at the Friends’ School.”
Leisure Activities
Villagers take part in more than 65 different activities with the top ten most popular shown below:
| Activity | % | ||
| 1 | Walking | 37.57 | 68 |
| 2 | Gardening | 34.25 | 62 |
| 3 | Reading | 27.07 | 49 |
| 4 | Television | 19.34 | 35 |
| 5 | Music | 17.68 | 32 |
| 6 | Cinema/Films | 12.15 | 22 |
| 7 | Theatre | 11.60 | 21 |
| 8 | Sport | 11.05 | 20 |
| 9 | Golf | 9.39 | 17 |
| 10 | Cycling | 8.84 | 16 |
| 10 | Dining Out | 8.84 | 16 |
However if we add all the individual ‘sports’ described in the survey to the Sport category, this number increases to 73 (40.33%) and puts Sport into first place.
Other Facts and Figures
- 10.5% shop mainly in the village shop
- 61.46% grow or produce some of their own food at home
- 44.19% do voluntary work in the village or elsewhere
- 40.06% keep a domestic pet
- 6.00% use an alternative form of energy of which more than half is solar.
Although we have tried to be as accurate as possible, we have been reliant on the information supplied in the survey forms. For example, one form showed that the householder travelled extensively by rail and air and used the internet at home. However the householder did not record having either a telephone landline or mobile phone! – possibly just a missed data field.
Rev. Stevens survey recorded one lunatic in the population in 1877. We had to discard one returned form from our survey because we could not make any sense of the information given!
[1] Latest National and South East figures taken from the Office for National Statistics